Infographics vs. Post-Truth: The New Disregard for Information
Infographics director Thomas Heumann of Frankfurter Allgemeine Zeitung opens up about an era of information fighting against a tidal wave of fake news
Most people today assume a certain level of subjectivity in journalistic articles or other written texts. And yet, people put a different kind of trust in infographics: they expect infographics to deliver hard facts, well-researched analysis, and reliable information. But this special trust in infographics means that infographers have a special responsibility. And while infographics are not a primary target of “fake news” accusations, the basis of their integrity is in danger: in the post-truth era, people not only disregard information provided by the news media but information in general.
Devaluation of Information
Due to the social developments of the last decade resulting from the financial crisis, information has lost its promise as a competitive advantage for professional careers and social/political participation and influence in Western societies. With the loss of upward social mobility, many people feel that their way of life, job security, pensions, medical care, and children’s futures are in danger.
In many respects, information on these people, known as the “losers of globalization,” is not representative of their actual situation. Unemployment statistics are a prime example. While they do not qualify as fake news, they are based on very strict definitions of unemployment and do not reflect the drastic increase in underemployment or “felt unemployment” in the last two decades. Too often, people with several minimum wage jobs, part-time workers who cannot change to full-time employment, and parts of the population who have been forced to give up looking for work are not taken into account in these statistics.
A good example illustrating that would be the two measures that exist in America to track unemployment: The standard unemployment rate is U-3 (Total Unemployed). The more comprehensive U-6 rate adds discouraged workers (having temporarily given up looking for work), marginally attached workers, and people forced into part-time employment. There are good reasons to prefer the U-3 rate: exactness, comparability, no “soft” criteria, and estimates. In times of crisis, however, many employees are crowded out of the job market, regional disparities grow, and job security goes down. And these trends are better—but by no means fully—described by the U-6 rate.
How do people react to reports that only address standard unemployment rates when their felt situation—whether personally, regionally, or socially—is markedly worse? Either they accept this information and attribute their actual or feared social decline to individual weakness, or they believe the information is irrelevant to them and their real situation and is thus wrong. For example, the German standard indicator for housing costs is derived from all existing rentals without extra costs for heating. The felt housing cost increase tends to include these costs (and is probably influenced strongly by the considerably higher prices for new rentals). Thus, individual experiences and fears are more powerful than reported facts, making it easier for people to see prejudices or unsubstantiated rumors as the truth.
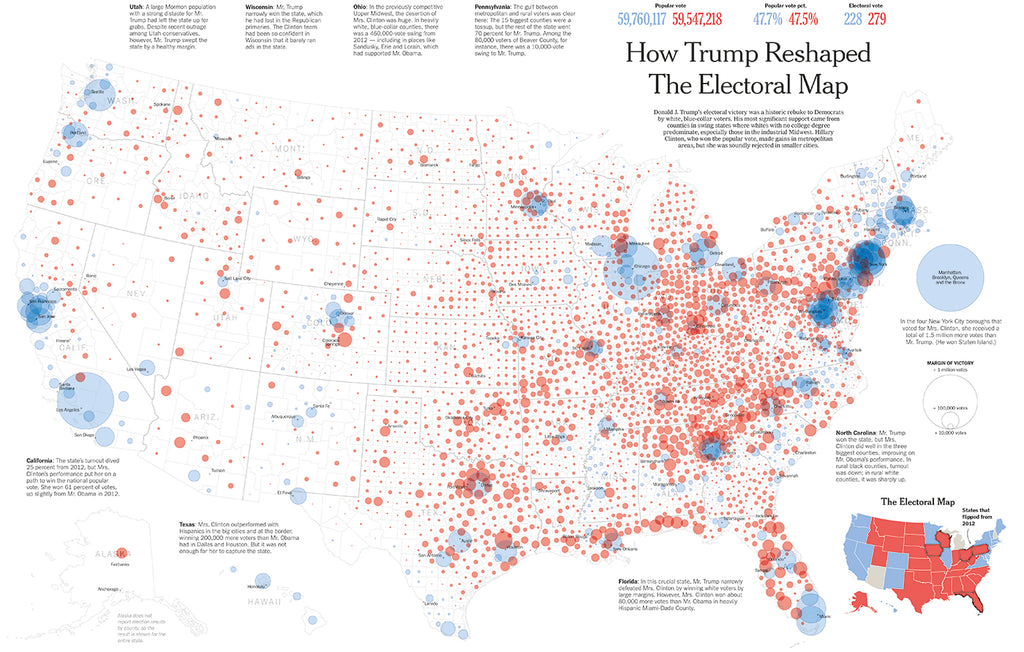
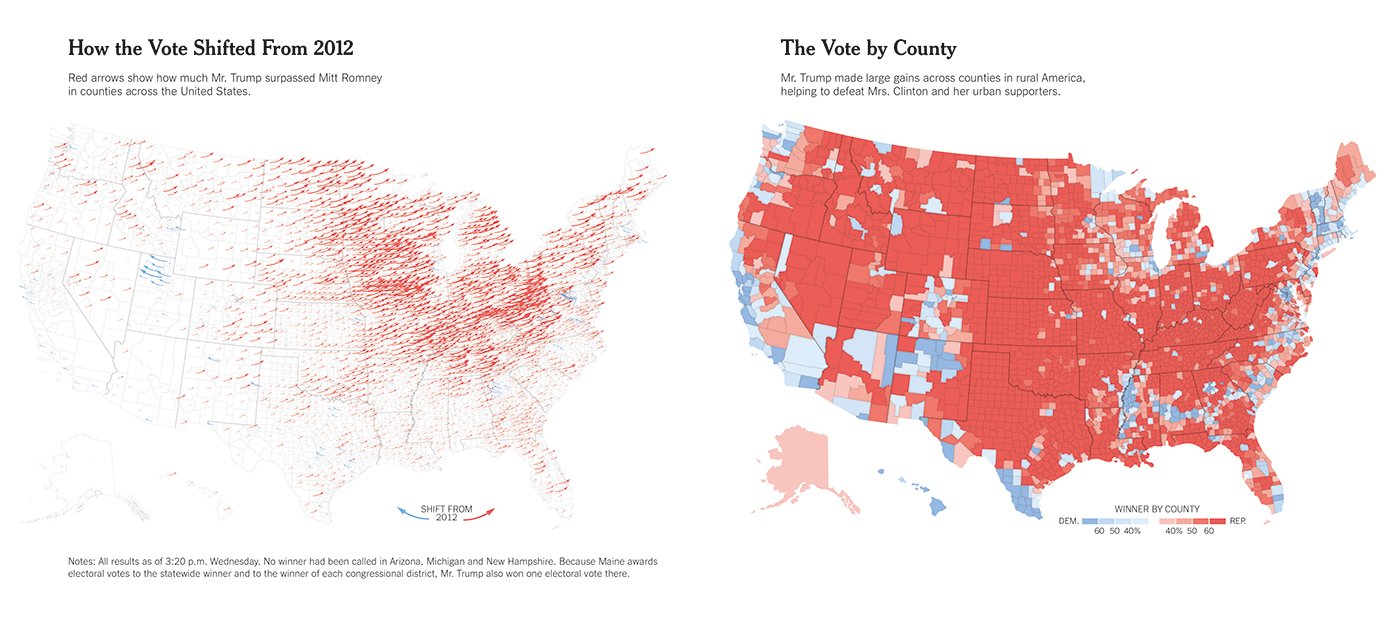
A Takeover in Red. How Trump Reshaped the Electoral Map. This double-page graphic published by the New York Times in November 2016 displays how Donald Trump won his victory in the most contested states with white voters without college degrees. The journalist team behind this infographic include Larry Buchanan, Ford Fessenden, Troy Griggs, Josh Keller, Shaeyoun Park, Alicia Parlapiano, Adam Pearce, Tim Wallace, Karen Yourish. (Infographic: New York Times, Visual Journalism)
Reassessing Statistical Indicators and the Scope of Infographic Reporting
While news media graphics have improved, there is still a lot of chartjunk—in advertising and elsewhere. Some of the points criticized remain or are ignored in the news media as well. Infographics do follow trends. Currently, the preference for more illustrative graphics leads to a somewhat more liberal size and representation of scale (without being blatantly wrong, of course).
In addition to examining the aforementioned quality criteria and mistakes, we also need to take a critical look at the information base of infographics within the context of social changes resulting from the financial crisis. First, that means taking socio-statistical content and indicator use into account.
In times of widening social divisions, average values tend to under represent the actual situation. Take income distribution as an example: if an income decline of 50% of the population is compensated for by an increase in the upper 5%, the average remains the same (median values would be more appropriate here). Averages were acceptable while there was a general upward trend economically, but, with increased social polarization, they are misleading. Second, we need to consider the general scope of reporting, in which struggling social groups might be underrepresented. The New York Times, for instance, increased its reporting on blue-collar, Republican-leaning communities after the unexpected outcome of the American presidential election of 2016.
Changing Place of Infographics in Editorial Processes
Infographers and infographic departments are a fairly recent development. In the past, graphic artists would receive assignments on certain subjects or be given data from a content editor (or, in large newsrooms and news agencies, by research editors) and create infographics. Today, infographers have a more editorial role in an increasing number of news organizations. They cooperate directly with newsrooms, proposing and planning news stories, and doing their research.
Somewhat ironically, the economic media crisis supported that trend: staff reductions and increasing work both for print and online teams created less capacity for time-consuming statistical research, adding to the general trend of replacing information-laden stories with lighter, more entertaining pieces or op-eds. In a way, infographics can—or are forced to—be more invested in determining content. Cooperation with data-based journalism is possible, though this cooperation seems to aim more at big news scoops that necessitate large data-crunching, such as the Panama Papers, and less on the daily grind of news reporting and quantitative analysis.

The National Post Nukes Ready to Fly by Richard Johnson. Based on the latest available data from the Bulletin of the Atomic Scientists, the author presents in this double-page from the Canadian newspaper National Post all the nuclear weapons around the world ready for immediate launch by any of the eight countries that have them. (Infographic: The National Post, Visual Journalism)
The fact that many infographers have more work and more responsibility also provides an opportunity for us to introduce new and more relevant indicators, widening the social scope of reporting, and doing our part to counter fake news campaigns. Ironically, we infographers have an important edge over specialist content editors: as non-specialists, we can more easily put ourselves into non-specialist readers’ shoes. By acknowledging and noting the points we don’t understand while grappling with a subject, we can use them as clues for better storytelling and making complex information more accessible.
Informed Decisions
The public has a right to information, and to make informed and responsible decisions. Decision-making is not confined to voting in national elections. Everybody—not just a member of an elite group—is a decision-maker: as consumers (whether to buy a car or use public transport, what store to shop at, etc.) and as citizens of a community. Infographers have the power to deliver more trustworthy information by taking socially relevant data into account in their infographics.
Fact-based news and global developments portrayed in a dynamic way to give unique context to information, infographics continue to be a cutting-edge way to convey complicated messages. Find out through Visual Journalism.

